In 2020, My Amazon Profit Tripled Through These 10 Categories
Whether you are a newcomer or an experienced shopkeeper, product selection is a long-term compulsory course. Taking Amazon as an example, how can sellers narrow the scope of their research among the 27 optional categories and find the most interesting niche market? Which categories have the greatest/least competition? Where is the highest profit margin? These are the conclusions that need to be studied for a long time!

Top 10 most popular categories
A 2020 Amazon seller status report shows that the top ten most popular categories and sellers on Amazon:
- Health & Household 45%
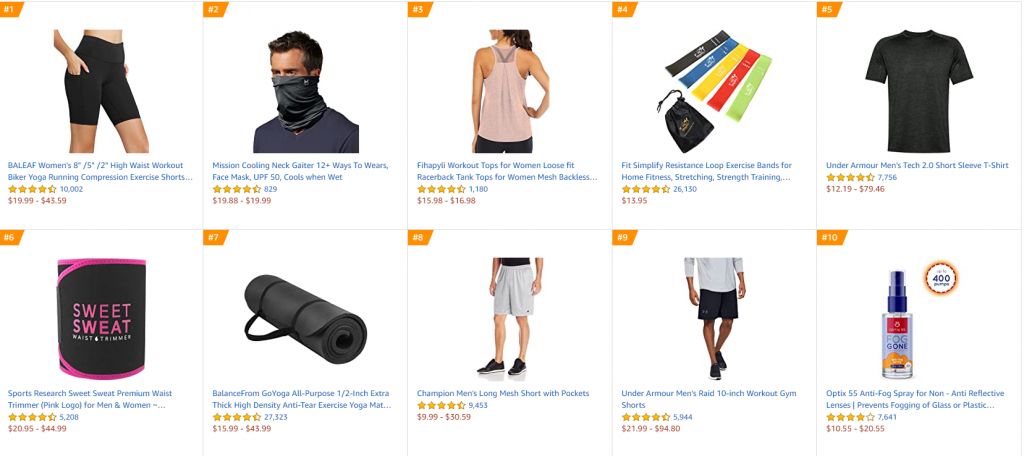
- Sports & Outdoors 23%
- Toys & Games 22%
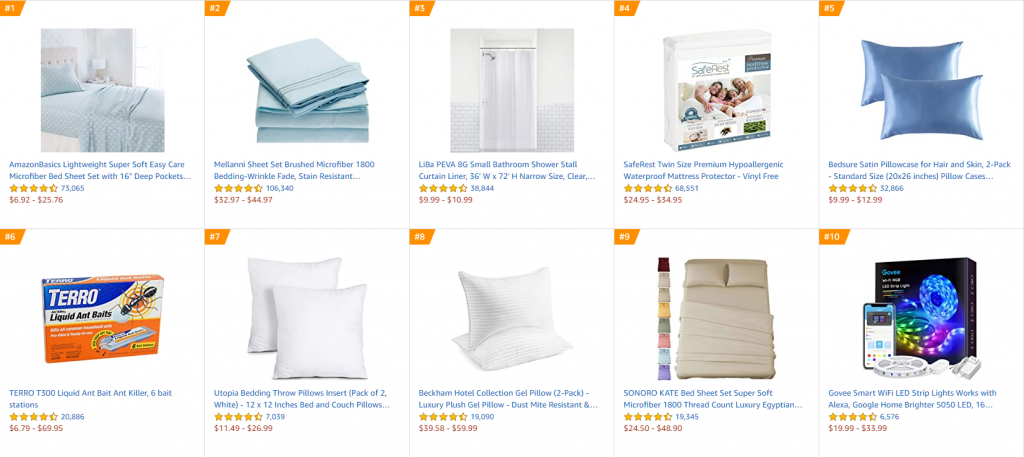
- Home & Kitchen 21%
- Beauty & Personal Care 21%
- Kitchen & Dining 20%
- Clothing, Shoes & Jewelry 19%
- Baby 18%
- Patio, Lawn & Garden 16%
- Tools & Home Improvement 16%
Sellers need to pay attention to whether the competition in these categories is too fierce. The last thing sellers want to happen is probably to enter an over-saturated market, with almost no chance to land on the first page of Amazon search results.
These categories have very high profits
- Handmade Products 26%
- Computers & Accessories 24%
- Appliances 24%
- Musical Instruments 22%
- Arts, Crafts & Sewing 21%
- Automotive s 21%
- Health & Household 20%
- Clothing, Shoes & Jewelry 20%
- Electronic 20%
- Baby 20%
Some categories may be more profitable than others, but within each category, there are subcategories that are lucrative. For example, Home & Kitchen and Kitchen & Dining are the highest-ranked categories among sellers, but competitive incentives, such as price wars, direct competition from Amazon, and increased PPC costs, have a large number of unprofitable subcategories.
In contrast, a slightly less popular analogy seems more profitable. For example, for “home & kitchen” and ” Handmade Products “, only 2% of sellers own 51%-100% of net profit in the former business, while 10% of sellers own 51%-100% of net profit in the latter industry.
What are the average monthly sales of different categories?
In general, the average monthly sales of Amazon sellers in almost all categories are between $1,000-$25,000. Specifically, some categories have significantly lower monthly sales (less than US$1,000), such as books, handmade products, and application games; other categories have outstanding monthly sales (over US$50,000), such as musical instruments and collectibles. And artwork, electrical appliances, and computers.
Why do many sellers sell in the “home &kitchen” category?
It’s no surprise that the “home %kitchen” category is the most popular among sellers. Because everyone uses these products in their daily lives. However, this is not the only reason why many sellers prefer this category. Other reasons include:
- Low barriers to entry: Selling in this category is easier than other categories because it does not restrict new sellers from entering.
- More intuitive product ideas: Everyone has a certain type of kitchen or household products at home (for example, spatulas, utensils, pillows, curtains, etc.), while in other categories, many people do not understand those types of products.
- There are no complicated regulations: sellers of supplements need to comply with Amazon and federal regulations, food must have a shelf life, toy sales are restricted, etc. There are fewer regulations for household and kitchen categories.
- Easy to manufacture: Compared with many other types of products, it is quite easy to find a supplier that manufactures kitchen products.
A report shows that 92% of people selling in “Home & Kitchen” have created their own brands.
How to find a less competitive category for sale?
1. Use Google Trends
Google Trends monitors consumer interests very well and is free. Sellers can check Google Trends every week to see if they can find opportunities to create products.
Simply enter a broad keyword in Google Trends, and it will show whether the topic is up or down. You can also view related topics, demographics, and related queries. Sellers can take a moment to explore this free tool.
. 2.Monitor consumer trends
Since the beginning of COVID-19, nearly 50% of consumers have purchased more groceries and cleaning products online and on Amazon. Although this is not surprising, consumer interest in other products has also surged during the epidemic, and smart Amazon sellers have followed and responded to this demand. For example, cooking utensils, puzzles, children’s games, home fitness equipment, and home office supplies have also attracted many home-isolated consumers.
Shopping behaviors are constantly changing. Although sellers may not be able to predict sudden changes in demand such as COVID-19 emergencies, these changes remind sellers that consumer needs may change at any time. Fortunately, after the epidemic, online and Amazon habits have become more and more ingrained in consumer behavior.
From the data, we can see that every category on Amazon has profitable sellers, which means it is not easy to find a category or market with limited competition. But the following points can be used for reference:
The choice of the category to be sold depends on the product, the competitiveness of the subcategory and the demand for the product;
Don’t decide the type of sale emotionally, let the data speak to the demand;
Profitability depends on whether a suitable product is found and how to operate in the future;
Make sure you know the basic operations, such as conducting proper product research, purchasing quality products, negotiating prices, placing PPC advertisements, etc.
As an Amazon seller, what category do you sell now, and has the product profit reached the data mentioned in the article?